This block is a more general equivalent of the XY Graph block from the Simulink/Sinks library - unlike XY Graph, it is not restricted to scalar inputs, it can handle vector X and Y as well (of course, the two vectors need to have the same number of elements). In every time instant t during the simulation, for a couple of vectors X = (x1,x2,...,xN), Y = (y1,y2,...,yN), N points (x1,y1), (x2,y2), ..., (xN,yN) are drawn simultaneously. In order to be able to distinguish individual curves, they are drawn in colours - 8 different colours are used in this order: blue, red, green, violet, cyan, black, yellow, gray - if N > 8, these colours are repeated in given order.
The block is typically used to display a phase-plane portrait of a system - if this is the case, then each phase-plane trajectory corresponds to one pair of elements of the vectors X and Y.
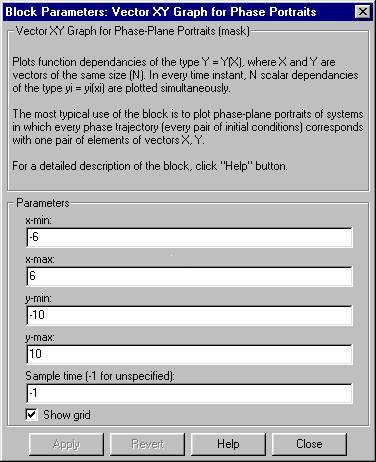
Real numbers determining the display range i.e. the x and y margins. As the block is most typically used to display phase-plane portraits, the axes are denoted as x1 and x2 in the graphic plot.
Sampling period - the meaning of this field is the same as the meaning of corresponding field of the XY Graph block. If the sampling period does not need to be specified explicitly, set this field to -1.
Checking this box will display the grid (similarly as MATLAB command grid on does).
The block is used in following Simulink schemes: